Hypothesis Testing
Objective
To determine what the true mean, μ, is not (gather evidence of ![]() ).
).
Given
Note: This notebook is built for cases where the population is normally distributed and the population standard deviation is unknown. This leads to the use of Student's T distribution; while this is mathematically appropriate for any sample size, the specific techniques used in this notebook are likely to result in long run times for large n.
The use of Student's T distribution is appropriate even for non-normal distributions if n is reasonably large. However, such use is beyond the scope of this course, and the use of this notebook under those conditions is perhaps inappropriate for computational reasons.
Definitions
Define the Student's T distribution (and load useful Mathematica packages).
![f_T[x_] := Gamma[(df + 1)/2]/Gamma[df/2] * 1/(df * π)^(1/2) * (1 + x^2/df)^(-(df + 1)/2)](../HTMLFiles/index_604.gif)
![]()
![]()
![]()
Check plot to ensure we have correctly entered the PDF
![]()
![[Graphics:../HTMLFiles/index_609.gif]](../HTMLFiles/index_609.gif)
Sample Data
Sample data, if provided
![]()
![]()
Sample Statistics
If sample data is provided, compute the appropriate sample statistics. If the sample statistics are provided, enter them here.
![]()
![]()
![]()
![]()
![]()
![]()
![]()
![]()
Required
For the given sample data and hypothesis, compute the p-value and state the appropriate conclusion about the null and alternate hypotheses.
Computations
1. State ![]() and
and ![]()
Note: Pay particular attention to the direction of the inequality in ![]() ; an incorrect choice here will result in an inappropriate conclusion even if all of the computations are correct.
; an incorrect choice here will result in an inappropriate conclusion even if all of the computations are correct.
![]()
![]()
![]()
![]()
![]()
![]()
Note: The procedures below attempt to be robust to the choice of the direction of inequality. However, if the test statistic is on the "wrong" side of ![]() (e.g. above
(e.g. above ![]() when the direction of inequality for
when the direction of inequality for ![]() is μ<
is μ<![]() , bad things may potentially happen, especially with the pure Mathematica functions.
, bad things may potentially happen, especially with the pure Mathematica functions.
2. Calculate the Test Statistic

![]()
3. Find the P-Value
a. Plot the distribution of the test statistic if ![]() is true
is true
![]()
![[Graphics:../HTMLFiles/index_637.gif]](../HTMLFiles/index_637.gif)
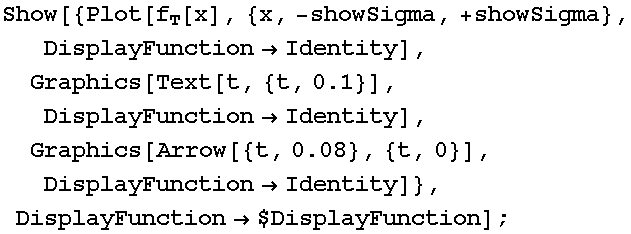
b. Plot the test statistic on the number line
![]()

![]()
![[Graphics:../HTMLFiles/index_641.gif]](../HTMLFiles/index_641.gif)
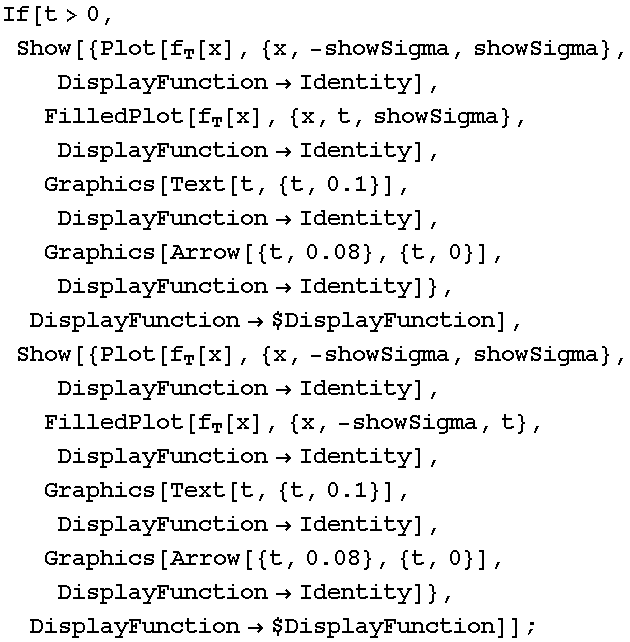
Note: as you can see from the code to display it, adding the test statistic (and other modifications to the plot we will encounter shortly) are both doable in Mathematica and significantly more complex than cadets are normally expected to master.
While this display code has been somewhat tested, it is not guaranteed to be robust.

![[Graphics:../HTMLFiles/index_643.gif]](../HTMLFiles/index_643.gif)
c. Calculate the appropriate area based on the form of ![]() (one-tailed test)
(one-tailed test)
![pvalue = ∫_ (-∞)^(-Abs[t]) f_T[x] x](../HTMLFiles/index_645.gif)
![]()
WARNING: the use of "-Abs[t]" in the integral is to ensure that we are looking at the left tail, regardless of the actual sign of t. This exploits the symmetry of the Student's T distibution -- if you are modifying this notebook for other purposes, beware.
![]()
![]()
Note: the following two procedures are not taught in this course, but are provided for crosschecking of solutions by instructors. Note that if sample data are not provided, the invocation of MeanTest will fail.
![]()
![]()
![MeanTest[sample, μ_0, FullReport→True, TwoSided→False]](../HTMLFiles/index_651.gif)
![{FullReport→ {{Mean, TestStat, Distribution}, {2., -5.19615, StudentTDistribution[2]}}, OneSidedPValue→0.0175494}](../HTMLFiles/index_652.gif)
Solution
Interpret the p-value in terms of the original problem, to include the words true mean and units.
| Created by Mathematica (July 20, 2006) |